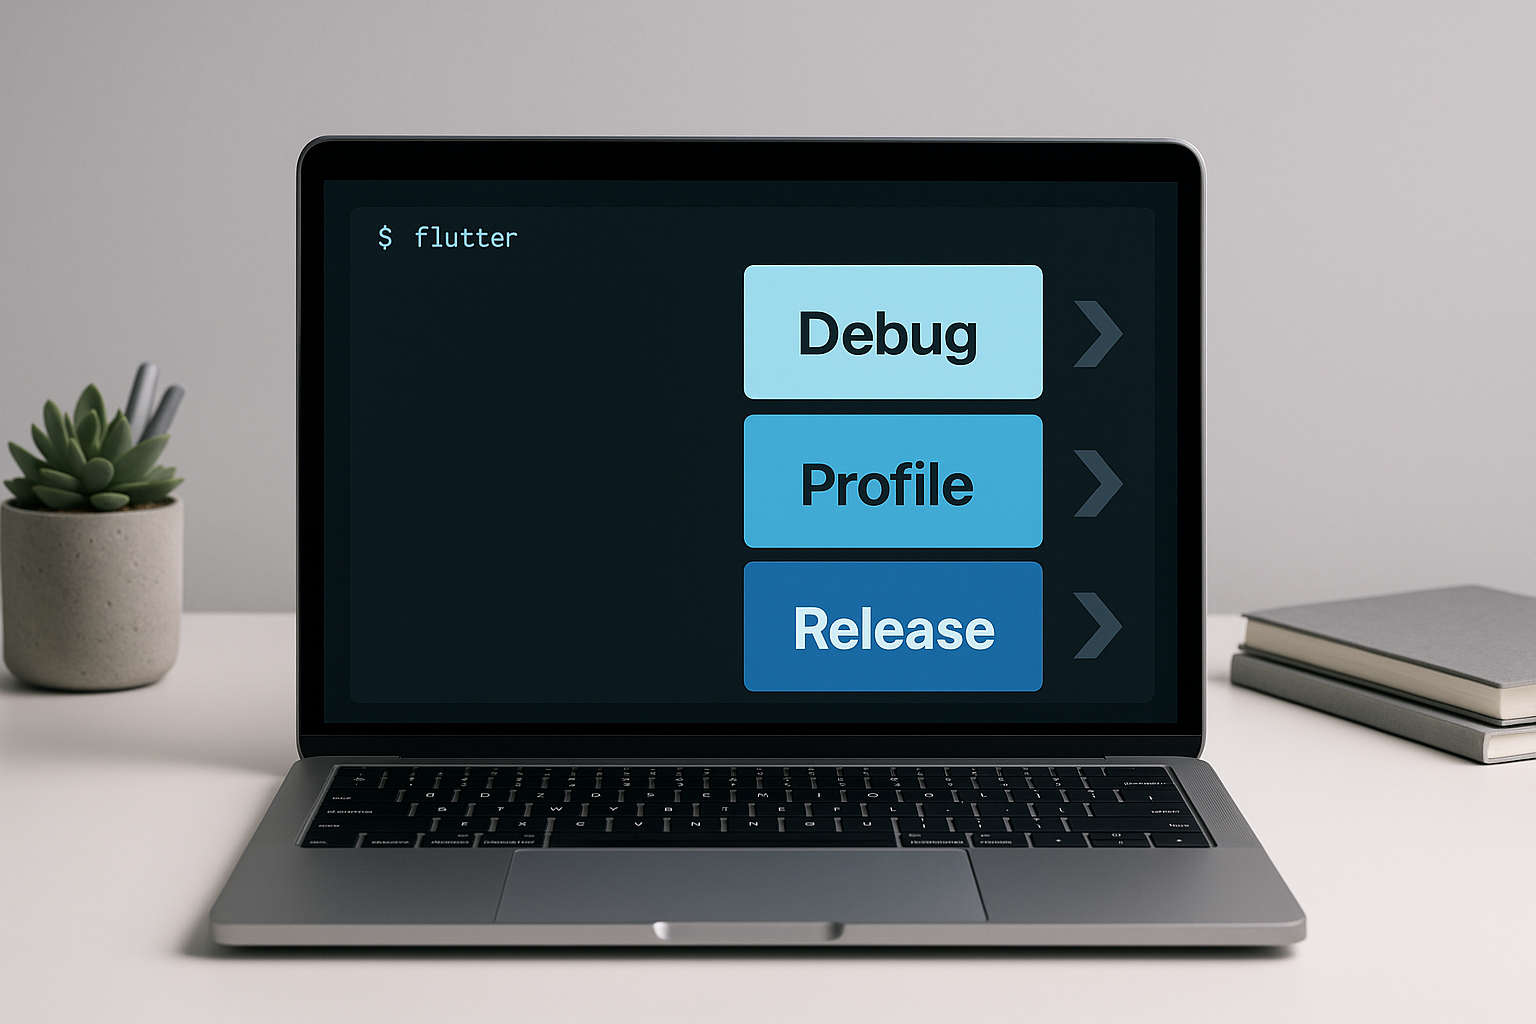
Flutter build modes control how your app is compiled, instrumented, and optimized. This guide explains Debug, Profile, and Release—what each does, how to run them, and when to use which in day-to-day development and CI.
Audience: BeginnerTested on: Flutter 3.x, Dart 3.x, macOS 14 / Windows 11, Android 14 / iOS 17
At a glance
| Mode | Purpose | Speed | Assertions & debug | Typical use |
|---|---|---|---|---|
| Debug | Fast edit–refresh loop | Slowest | Enabled (asserts, service extensions, DevTools) | Everyday coding, hot reload |
| Profile | Performance measurement | Near-release | Limited (no asserts; perf overlays & tracing on) | Benchmarking & jank hunting |
| Release | Ship to users | Fastest | Disabled (no debug checks) | Store builds & staging |
How to run each mode
# Debug (default): hot reload, asserts, DevTools
flutter run

# Profile: measure real performance (no debug asserts)
flutter run --profile    # or: flutter build apk --profile (Android only)

# Release: final optimizations, tree-shaking, minified Dart
flutter run --release
# Artifacts for distribution:
flutter build apk --release
flutter build appbundle --release        # Google Play
flutter build ipa --release              # Xcode-managed iOS archive
What changes under the hood
- Compiler pipeline — Debug uses JIT for hot reload; Profile/Release use AOT for optimized native code.
- Assertions & diagnostics — Enabled in Debug, off in Profile/Release (affects behavior and timing).
- Sizes — Release removes dev tooling and tree-shakes code/assets; binaries are smaller and faster to launch.
- Performance overlays — Profile exposes tracing (e.g.,
flutter run --profile --trace-skia) and DevTools CPU/Memory.
When to use each
- Debug for everyday feature work and widget iteration (hot reload, breakpoints).
- Profile right before optimizing: reproduce jank, measure frame times, compare builds, verify that “fast paths” are actually fast.
- Release for QA/staging and anything users will touch (APK/AAB/IPA). Never judge performance by Debug.
Reliable performance workflow
- Implement in Debug until feature-complete.
- Switch to Profile on a physical device, record a representative user flow.
- Investigate with DevTools (CPU profile, frame chart). Fix hot paths (
constwidgets, lazy work, list virtualization). - Validate in Release to confirm wins and catch size regressions.
Common pitfalls
- Measuring in Debug → misleadingly slow; use Profile/Release on real hardware.
- Feature flags only set in debug → code paths differ across modes; keep parity or guard carefully.
- Asset or icon caching → stale in Release; do
flutter clean→ rebuild. - Assertions masking bugs → logic inside
assert()won’t run in Release; avoid side effects in asserts.
CI suggestions
# Lint & analyze (fast)
dart analyze

# Tests in debug VM
flutter test

# Profile perf check (smoke)
flutter drive --profile -t integration_test/perf_test.dart

# Shipping artifacts
flutter build appbundle --release
flutter build apk --release --split-per-abi
FAQ
Q: Why does my app look different in Release?
A: Debug banners, performance overlays, and certain dev-only code are removed; also timing changes can reveal race conditions—test late-init flows in Release too.
Q: Do I need Profile for iOS/Android both?
A: Yes, behavior differs per platform/CPU/GPU. Profile on each target device you support.
Conclusion
Use Debug to build features quickly, Profile to measure real performance, and Release to validate and ship. Treat mode switches as part of your development rhythm and wire them into CI to keep quality predictable.
https://docs.flutter.dev/testing/build-modes
https://docs.flutter.dev/tools/devtools/performance
https://docs.flutter.dev/perf/best-practices
Updated: 2025-10-26


Comment